WHITE PAPER
OLTS & OTDR: A Complete Testing Strategy
Download PDF
Overview
Fiber is playing an increasing role in most network installations, driven by the need for higher-bandwidth applications in data centers and backbone cabling systems, as well as emerging low-latency 5G and FTTX deployments in service provider networks. While copper continues to dominate horizontal cabling systems where few devices require more than 10 Gbps and many are powered via Power over Ethernet (PoE), the use of fiber cabling systems is on the rise wherever speeds are reaching 40 and 100 Gbps and beyond, or wherever there is a need for greater distance, noise immunity, and security. According to recent studies, the global fiber optics market is projected to reach USD 13.26 billion by 2033, up from USD 8.07 billion in 2023.
 |
As fiber deployments become commonplace, network owners and technicians are paying more attention to the two crucial devices for testing fiber optical cables: the Optical Loss Test Set (OLTS) and the Optical Time Domain Reflectometer (OTDR).
- An OLTS provides the most accurate insertion loss measurement on a link by using a light source on one end and a power meter at the other to measure precisely how much light is coming out at the opposite end. It is required for fiber testing per industry standards. Both TIA and ISO standards use the term “Tier 1” to describe testing with an OLTS.
- An OTDR characterizes the loss of the link for individual splices and connectors by transmitting light pulses into a fiber and measuring the amount of light reflected from each pulse. It is recommended for fiber testing per industry standards, essential for emerging short-reach single-mode applications and extremely valuable as part of a complete testing strategy. Testing with both an OTDR and an OLTS is referred to as “Tier 2” testing within TIA standards and “extended” testing within ISO standards.
While the measurements taken by these two instruments seem similar, they perform distinct and essential roles. This article explains how these testers work, when to use them, and how they complement each other to ensure the performance of fiber optic links and maximizing customer satisfaction.
On This Page
- What Is an OTDR?
- What Is an OLTS?
- Why You Should Test for Reflectance in Addition to Insertion Loss
- How to Read an OTDR Trace
- What Are the Benefits of Using an OTDR?
- How OLTS and OTDR Work Together
- The Advantages of Integrated OLTS and OTDR Test Results
- Appendix: The Importance of Fiber Cleaning and Inspection
- Appendix: What Is OTDR Event Mapping?
What Is an OTDR?
Unlike the OLTS, which measures the amount of light coming out of the far end, the OTDR measures the amount of light reflected back to the source. By computing the difference between the amount of reflection at the near and far ends, the OTDR can infer the amount of loss in the fiber.
OTDRs use special pulsed laser diodes to transmit high-power light pulses into a fiber. Most light travels away from the source as the pulses travel down the fiber. High-gain light detectors in the OTDR measure any light that is reflected from each pulse. The OTDR uses these measurements to detect events in the fiber that reduce or reflect the power in the source pulse. The normal structure of the fiber and minor defects in the glass also cause a small fraction of the pulse light to scatter in a different direction. This phenomenon of light scattered by impurities in the fiber is called backscattering.
When a pulse of light meets connections, breaks, cracks, splices, sharp bends or the end of the fiber, it reflects due to the change in the refractive index. These reflections are called Fresnel reflections. Reflectance is the amount of light reflected, not including the backscatter, relative to the source pulse. It is expressed in dB units as a negative value for passive optics, with values closer to 0 representing larger reflectance, poorer connections, and greater losses. This measurement is the same as return loss, which is expressed as a positive value. Return loss indicates how much signal is lost by comparing input power to output power versus reflectance, which compares output power to the amount of light reflected. For both reflectance and return loss, the further the value is away from zero, the better the results. (For more information on the difference between reflectance and return loss, read What is Return Loss?)
What Is an OLTS?
An OLTS is a mainstay for testing fiber optic cabling because it provides the most accurate method for determining the total loss of a link. It’s required by industry standards to ensure the link can meet the loss requirements for a given application.
An OLTS includes a light source and a power meter. The light source produces a continuous wave at specific wavelengths connected to one end of the fiber. The power meter uses a photodetector connected to the opposite end of the fiber link, which measures optical power at the same wavelengths the light source produces. These two devices work in concert to determine the total amount of light lost.
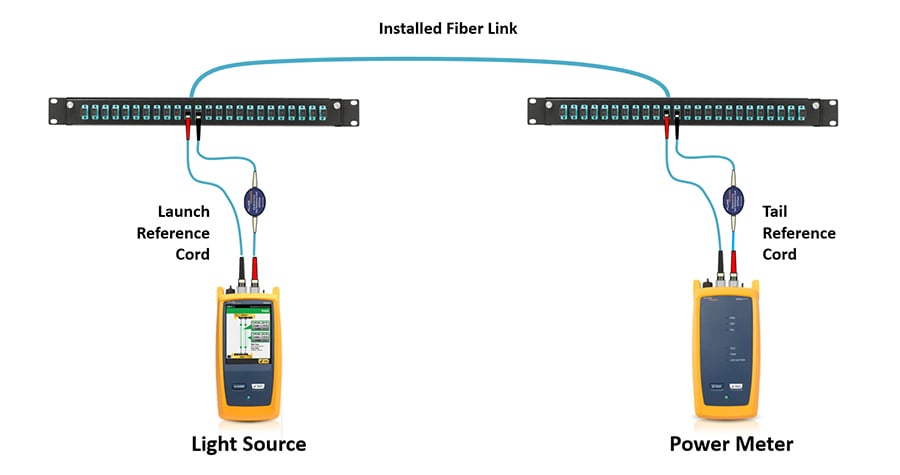 |
Figure 1: OLTS measurements use a light source on one end of the link and a power meter on the other. Models such as the CertiFiber™ Pro maximize testing speed by testing two fibers simultaneously (duplex) using a light source and power meter at each end. Together, they determine the total amount of light lost on a link.
Industry standards specify insertion loss limits for specific fiber applications as a combination of a loss budget and length. As required by both TIA 568-3.D and ISO/IEC 14763-3 standards for Tier 1 fiber optic testing, the loss measured with an OLTS is compared to the loss limits for a given application to determine if it passes. Note that a basic light source and power meter (LSPM) also accurately measures loss per industry standards, but it does not include some of the key OLTS features that facilitate testing, such as duplex testing, hands-free bidirectional testing, preloading of loss limits, length measurement, and other advanced features. Length is especially important, because application limits are a combination of a loss budget and maximum length. Models such as the Fluke Networks CertiFiber™ Pro measure both loss and length, providing a clear pass/fail result that assures application support.
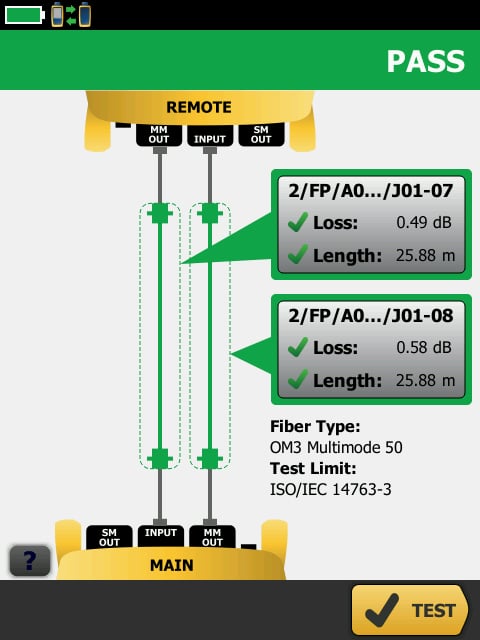 |
Figure 2: Results provided by an OLTS show the length of the fiber (in this example, two fibers) and the overall light loss, expressed in dB.
For multimode fiber optic testing that involves both lower-order modes (light that travels near the fiber core) and higher-order modes (light that travels closer to the cladding) that are inherently unstable, standards require the use of an encircled flux (EF) light source when using an OLTS. An EF-compliant light source controls the modes of light entering the cable, ultimately providing the most precise, accurate and repeatable test results.
Standards also recommend using the 1-jumper reference method when testing with an OLTS, since it includes the insertion loss values for the connections at both ends of the link, which more closely represents how the cabling plant will ultimately be used. The 1-jumper method references out the EF-compliant launch cord from the place where it connects to the light source to where it connects to the power meter.
In contrast, the 2-jumper method references out the connection between the two jumpers; that ultimately includes only one end connection in the loss measurement, providing only a partial depiction of the total loss. The 3-jumper method references out two connectors and therefore excludes the loss of both end connections under test. Some scenarios, such as testing links with connector types not supported by your testing equipment, will require a 2- or 3-jumper reference. (Read more about reference setting methods in our Demystifying Fiber Test Methods white paper.)
Why You Should Test for Reflectance in Addition to Insertion Loss
Reflectance has become increasingly important for emerging short-reach single-mode applications such as 100GBASE-DR, 200GBASE-DR4 and 400GBASE-DR4. While single-mode fiber applications historically have had larger loss budgets than multimode — 6.3 dB for 100 Gig over single-mode (100GBASE-LR4) versus just 1.9 dB for 100 Gig over multimode (100GBASE-SR4) — that is no longer the case with new short-reach single-mode applications. Not only do these new applications require more awareness surrounding reduced insertion loss requirements, but the limits are also now dependent on reflectance.
Multimode transceivers are highly tolerant of reflection, but single-mode transceivers are not. In fact, with high-power single-mode lasers, too much reflection can destroy the transceiver.
For new short-reach single-mode applications, IEEE specifies insertion loss limits based on the number and reflectance of connections. As shown in Figure 3 below, in a 100GBASE-DR4 application with four connectors that have a reflectance between -45 and -55 dB, the insertion loss is 3.0 dB (highlighted in red in the table). But adding four connectors with a reflectance between -35 and -45 dB, the insertion loss goes down to 2.7 dB (highlighted in yellow in the table). Note that while a specialized OLTS may measure reflectance, most measure return loss, which is a positive number. OTDRs measure reflectance, which is a negative number and the value specified by IEEE standards.
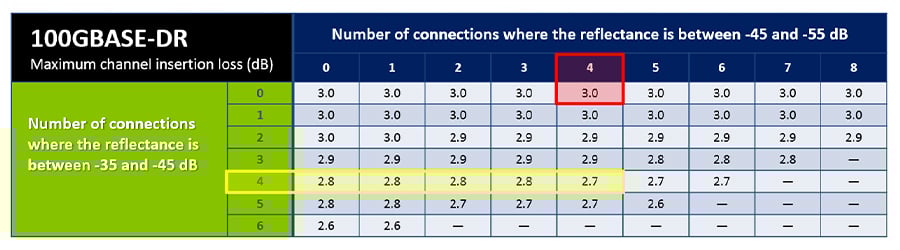 |
Figure 3: For emerging short-reach single-mode applications, IEEE standards specify insertion loss based on the number and reflectance of connections.
How to Read an OTDR Trace
OTDRs display trace results by plotting reflected and backscattered light versus distance along the fiber, essentially characterizing any reflective and non-reflective events in a fiber link.
OTDR traces have several common characteristics:
- Most traces begin with an initial input pulse resulting from a Fresnel reflection occurring at the connection to the OTDR.
- Following this pulse, the OTDR trace is a line sloping downward and interrupted by gradual shifts. The gradual decline results from insertion loss or attenuation of the backscattering as light travels along the fiber. This decline may be interrupted by sharp shifts that represent a deviation of the trace in the upward or downward direction. These shifts, or point defects, are typically caused by connectors, splices, or breaks.
- The end of the fiber is identified by a large spike (reflection), after which the trace drops dramatically down the Y axis.
- Finally, the output pulses at the end of the OTDR trace result from reflection occurring at the output of the fiber end face, referred to as “ghost” events that are technically non-existent events.
As shown in the trace example in Figure 4, the Y axis represents power level, and the X axis shows distance. When you read the plot from left to right, the backscatter values decrease because the loss increases as the distance increases. Interpreting OTDR traces may seem intimidating to novice users, but they don’t have to be; some advanced OTDRs automatically interpret the trace and provide a detailed graphical map of events (see Appendix, What Is OTDR Event Mapping?).
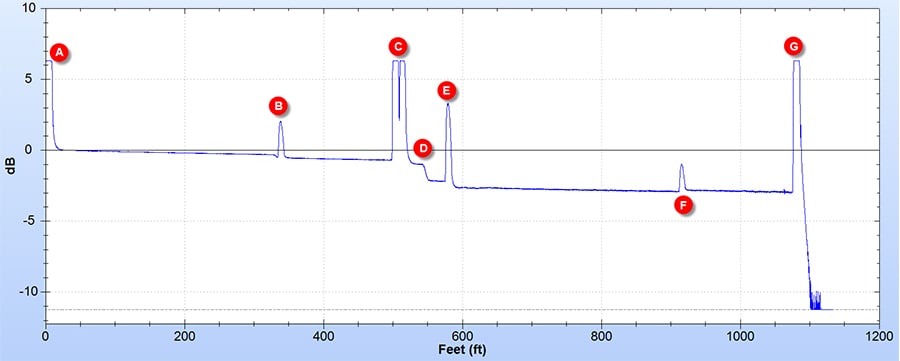 |
Figure 4: Typical OTDR trace, showing length, a gradual decline in light strength, and events. (A) OTDR connector: Note the large reflectance makes it impossible to characterize the loss in the first connector. In this case, a launch fiber of about 300 ft. is being used. This allows the OTDR to characterize the first connector of the link under test (B). (C) shows two connectors that are too close together for the OTDR to properly characterize the loss in each. (D) is a loss event with no reflectance, likely a bad splice or APC connector. (E) shows a typical UPC connector with reflectance and loss. (F) depicts a connector with reflectance where the signal after the connector is stronger than before, often called a “gainer.” This is indicative of connecting fiber types with different backscatter properties. (G) is the end of the fiber. Note that the strong reflection makes it impossible to determine if there is a connector there and what its performance is unless a “tail” fiber is attached.
When using an OTDR, testing is done bidirectionally, since the loss of specific connectors and splices depends on the test direction. Even if two connected fibers are the same type (e.g., OM3, OM4, etc.), the fibers may have slight variations and different backscatter coefficients that can cause more light to be reflected after a connection than before. If OTDR testing is performed in only one direction, it can result in a measured loss value that is less than it actually is or even negative (referred to as a gainer — event F in Figure 4). Likewise, testing in the other direction, where less light is reflected after the connection, can result in a measured loss that is greater than actual loss. That’s why OTDR testing is performed bidirectionally, and the loss results are averaged to get a more accurate result.
When performing bidirectional testing, it’s also important to not disconnect the launch and receive fibers from the fibers being tested to maintain the same alignment for both tests and ensure accuracy. Thankfully, testers like the Fluke Networks OptiFiber™ Pro make it easy to test in both directions from one end by using a loop at the remote end of a duplex link and automatically averaging the two readings to provide a final loss measurement.
What Are the Benefits of Using an OTDR?
The OTDR has often been regarded as a troubleshooting tool, and indeed it’s valuable for locating events that are causing performance issues after the cabling plant is live. However, characterizing the entire link via an OTDR trace during initial testing offers several benefits for both the technician and the customer, and it can uncover potential problems that an OLTS may miss.
An OLTS calculates the total loss of the entire link in the most accurate and repeatable way, as required by industry standards, and a PASS or FAIL indicates whether the link falls within the maximum insertion loss for a given application. But specific event losses are completely invisible to an OLTS — which means that a good connection can hide a bad one. Why does this matter?
A fiber link can contain several connectors and/or splices, and often different technicians perform terminations and splices, some of whom may be more skilled than others. Other disturbances, such as dirty fiber end faces, macrobends, and microbends can also occur within the link due to poor workmanship or other installation factors. Characterizing the fiber with an OTDR makes it possible to pinpoint the location of any fault and verify that the quality of the installation meets the design specifications for current and future applications. It also ensures that there are no unplanned loss events due to poor cable management or installation errors. It allows the technician to see the performance of specific connection points and their locations within the link, so it’s easy to identify any questionable connection points that may need to be addressed due to air gaps, poor fiber core alignment, lack of cleanliness, or other problems that can occur during installation. A link may even pass a loss test yet still fail to carry network traffic due to reflectance issues, and only the OTDR will find the problem. (Learn more in Short-Reach Single-mode Puts Reflectance on the Radar.)
For example, common requirements are that the loss associated with a splice should be no larger than 0.3 dB and that the loss associated with a connector should be no more than the manufacturer’s specification (typically 0.2 dB to 0.5 dB). With today’s stringent insertion loss requirements that have less room for error, identifying the location and loss of specific events in a fiber link becomes more critical than ever — especially considering that total loss can increase over time due to poor cable management, splice degradation, dirty fiber end faces, and even loss of power due to transmitter age.
Characterizing the fiber link with an OTDR also confirms precisely how many connections exist within a link, which is information that cannot be acquired with an OLTS. This is valuable for identifying when a link contains too many connection points due to a cross-connect or links being patched together, which can cause the end-to-end link to exceed loss limits for a given application.
How OLTS and OTDR Work Together
When it comes to fiber testing, if you use an OTDR, is an OLTS still necessary? Yes.
Industry standards require the use of an OLTS to ensure application compliance because it accurately measures total fiber insertion loss. Using an OTDR does not replace the OLTS; the total insertion loss measurement achieved with an OTDR is an inferred calculation that doesn’t necessarily depict the total loss that will occur on a link once it is live. Especially in the case of multimode fibers, where standards specify precisely controlled launch conditions, OTDR tests are not as accurate or repeatable as an OLTS.
When testing or commissioning a sizable number of links, the speed difference between the OLTS and OTDR becomes a significant issue. A high-performance OLTS, such as the CertiFiber Pro, can measure a duplex link at two wavelengths in under three seconds. Even a fast OTDR, like the OptiFiber Pro, will take at least 12 seconds to characterize a fiber. To get an accurate measurement with an OTDR, the fiber must be tested in the reverse direction. The SmartLoop™ capability of the OptiFiber Pro makes this test easy, but it still requires an additional 12 seconds plus the time to swap the launch fibers, for a total testing time that is at least ten times longer than using an OLTS.
On the flip side, if you use an OLTS and the fiber link passes, is an OTDR necessary? The answer to this question isn’t quite as simple.
First, it’s important to understand that the specification for a given project must be followed. If the specification requires OTDR characterization (Tier 2 testing in TIA standards and extended testing in ISO/IEC standards), then an OTDR is indeed required along with OLTS insertion loss testing. If it is not specified, OTDR testing is technically not required — but it is highly recommended by both industry standards and experts due to the value of characterization and calculating reflectance in emerging short-reach single-mode applications. In fact, due to ever-tighter loss budgets and less room for error, many network owners and designers are setting not only overall loss budgets, but also loss budgets for individual splices and connectors, which can only be verified with an OTDR.
Additionally, OTDR characterization is recommended before OLTS insertion loss testing. The ability to measure the number, location, and performance of each splice and connector with an OTDR allows you to correct problems during the installation process and prior to final insertion loss testing with an OLTS, rather than after the network is live.
Further, the final OLTS insertion loss test results are required for definitive proof of compliance. If testing fails and you need to troubleshoot with an OTDR, you will also have to test again with the OLTS. Regardless of whether both testers are used as recommended, cleaning and inspection of fiber end faces is a must before testing (see Appendix, The Importance of Fiber Cleaning and Inspection).
The Advantages of Integrated OLTS and OTDR Test Results
Not only do an OLTS and OTDR complement each other for a complete testing strategy, but together they help protect the technician via comprehensive documentation. The combination of both an event trace and a total loss measurement that demonstrates compliance at the time of installation makes it very difficult for anyone to cast blame on the technician if performance issues arise down the road.
Having documented traces for each link also gives technicians and customers a frame of reference when troubleshooting to easily identify exactly what went wrong and where. For example, by comparing the original trace acquired during testing to the new trace, it can be easy to see if a new event happened due to a poor cable management, or if a connection point increased in loss over time due to contamination or other post-installation issues.
When it comes to selecting an OLTS and OTDR, select tools that are easy to use and capable of delivering test results and reports in an easy-to-understand format. It’s also a time and accuracy benefit when results from both can be integrated into a single test report for a given project via a test management and documentation service that allows technicians to upload results from both testers. Integration of the results from both the OLTS and OTDR provides complete, comprehensive documentation that satisfies customers, protects technicians, and facilitates troubleshooting once the cabling plant is live.
OLTS and OTDR testing are different yet critically complementary. It’s important to understand the differences between OLTS and OTDR testing and the benefits both provide, and it’s also important to recognize that together they perform a complementary role in the fiber testing process. And when an OLTS and OTDR are designed to work in tandem with each other, generating integrated documented results, their benefits are greatly enhanced.
Appendix: The Importance of Fiber Cleaning and Inspection
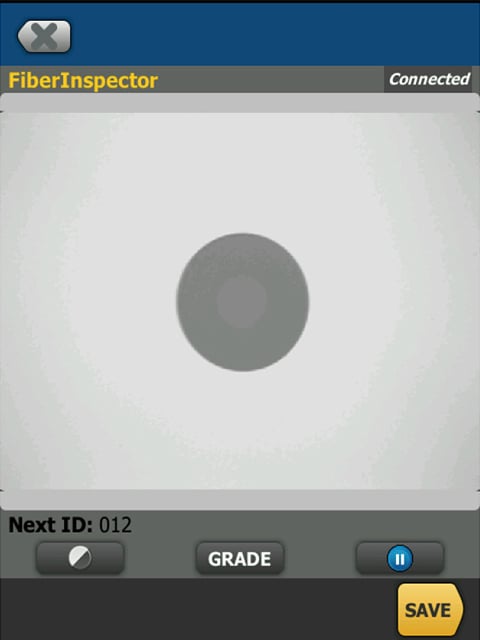
Regardless of whether you’re using an OLTS alone for Tier 1 testing or both an OLTS and OTDR for Tier 2 or extended testing, cleaning and inspection must be part of the process. Contaminated connections remain the number one cause of fiber-related problems and test failures; a single particle on the core of a fiber can cause loss and reflections. While an OTDR can expose dirty connections, cleaning and inspecting end faces before installation can reduce testing time and inaccuracies.
Any and all end faces, even brand-new connectors and factory-terminated plugs and pigtails, should be inspected for cleanliness before mating. This includes both ends of test reference cords, fiber jumpers, and pre-terminated trunk cables. Even interchangeable adapters used on test equipment should be inspected on a regular basis and cleaned when needed, since they too can accumulate debris. Some manufacturers have recently succeeded in improving the cleanliness of new factory-terminated connectors, but it is recommended that these too should be inspected and cleaned if necessary, even fresh out of the bag. Remember that even the dust cover designed to protect the fiber end face can be a significant source of contamination.
Upon inspection, if cleaning is required, it’s important to use a specially designed fiber optic cleaning tool, such as the Fluke Networks Quick Clean™ cleaners. For more stubborn contamination, such as oils, a solvent specifically formulated for end face cleaning (such as a Fluke Networks Fiber Optic Solvent Pen) should be used. Isopropyl alcohol (IPA) was used for many years to clean fiber end faces, but today’s specialized solvents have a lower surface tension that makes them far more effective at enveloping debris for removal and dissolving contaminants. IPA can also leave behind a “halo” as it dries, which not only causes attenuation but also can be difficult to remove. No solvent should remain on the end face after cleaning.
 |
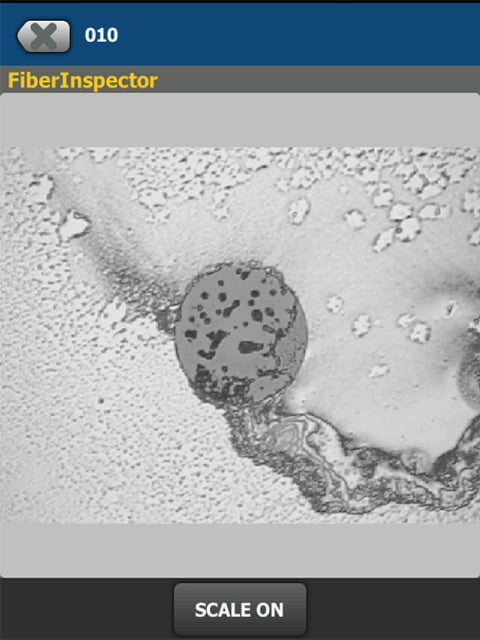 |
Figure 5: Specialized solvents (left) are far more effective at cleaning end faces than IPA that can leave behind a residue (right).
Appendix: What Is OTDR Event Mapping?
When looking at an OTDR trace that graphically displays the characterization of a fiber link, experienced OTDR users can typically recognize reflective events for launch cords, connectors, mechanical splices, fusion splices, mismatched fibers, and the end of the link. They will also likely know that the little blips visible after the end of the link are ghosts and not real events to be concerned with. However, not everyone is a trace analysis expert, or perhaps a technician is simply out of practice.
Some advanced OTDRs come with highly developed logic that automatically interprets the trace and provides a detailed graphical map of events that indicates the location of connectors, splices, and anomalies. This event map is ideal for those who might not be proficient at reading a trace, and it can also be a valuable training tool to help technicians improve their trace interpretation skills. For example, if they are unsure what type of event they’re looking at on the trace, they can switch back and forth between the trace and the event map to help test their skills and verify exactly what they are seeing.
 |
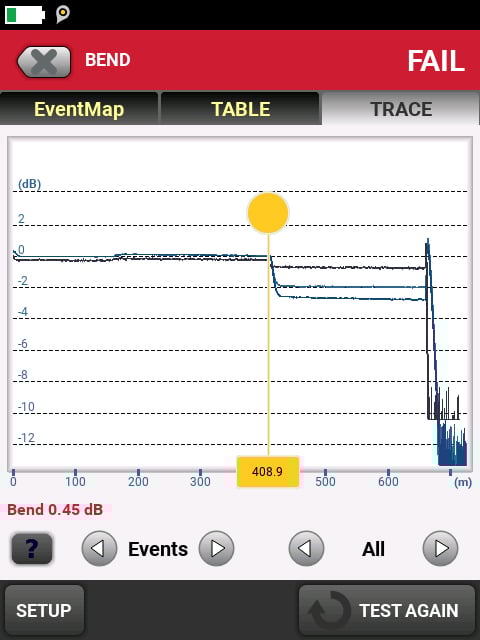 |
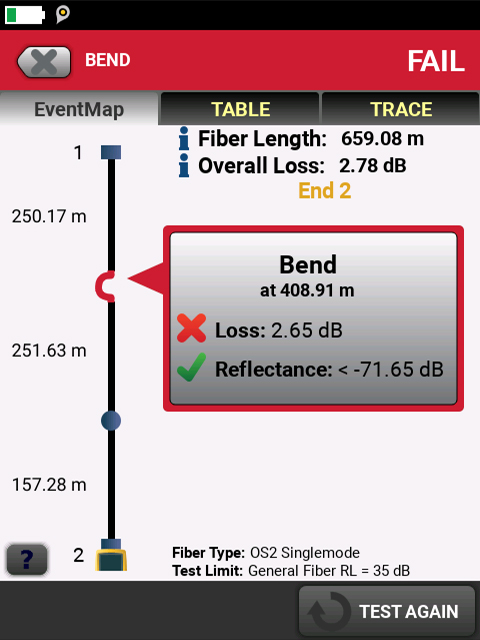
Figure 6: Bends are characterized by a lack of reflectance with higher loss at longer wavelengths as shown in the trace at right. Advanced OTDRs recognize events like these and present them in an easy-to-interpret manner (left).
Related Products
CertiFiber® Pro Optical Loss Test Set
OptiFiber® Pro OTDR Family