WHITE PAPER
Fiber Optic Encircled Flux Round Robin Testing
Download PDF
Overview
This white paper discusses results from 19 months of round robin testing initiated to check the current state of equipment, designed to measure Fiber Optic Encircled Flux (EF). There was some skepticism that, since EF represents a very restricted launch, the EF equipment would not have the precision to make such a measurement with low uncertainty. A similar test was conducted within IEC SC86B several years ago, and the data showed that some modal launch equipment measured outside the EF template. It was not revealed if the equipment was properly calibrated for that test. The purpose of the new round robin test was to measure variability of EF measurement equipment, and to provide a level of confidence for those making these types of measurements.
On This Page
Introduction
The encircled flux (EF) launch for multimode fiber sources continues to gain momentum in standards committees, with equipment suppliers, and users. The TIA working group, TR42.11, initiated an extensive round robin test, which attracted many interested participants and many members of IEC and ISO sub committees.
This round robin testing was initiated to check the current state of equipment designed to measure EF. There was some skepticism that, since EF represents a very restricted launch, the EF equipment couldn't provide the precision required to make such a measurement with low uncertainty. A similar test was conducted within IEC SC86B several years ago, and the data showed that some modal launch equipment measured outside the EF template. It was not revealed if the equipment was properly calibrated for that test. The purpose of the new round robin test was to measure variability of EF measurement equipment, and to provide a level of confidence for those making these types of measurements.
The round robin was conducted over a 19–month period. Test samples were evaluated by 14 different participants representing companies in North America, Europe, and Japan. There were five different types of near field launch measurement equipment used in the study.
The test samples used in the round robin were two LED-based, dual–wavelength sources. These test samples were not intended to represent a calibrated EF compliant launch per se since the focus of the round robin was to measure variance between EF equipment.
Test Protocol
The LED sources used during the testing were production units containing a dual wavelength 850/1300 nm “combiner”. Each of the two light sources can be used with either a 50 μm or 62.5 μm fiber optic test cord. The fiber test cords were 1 meter long and permanently affixed to the source's bulkhead. The instruments, one set up for 50 μm and one for 62.5 μm, were mounted on a platform as was the test cord. Only a short section of the test cord could be manipulated during measurements. Several “air turns” secured on the test cord served as a tuned mode filter. The mode filter was “tuned” so that 850 nm was set to the target of the EF template. The 1300 nm response remained within the EF template but had an offset from its target. This can happen in cases where the EF equipment has a separate imaging system for 850 nm and 1300 nm.
Participants collected data for the different EF cases: 850/1300 nm for 50 μm cabling, and 850/1300 nm for 62.5 μm cabling. For simplicity and because there is more interest in the 50 μm cabling data, only that data is shown in this paper. Each participant was required to make three measurements but the average value was used during the final analysis.
As a control, the sources were always returned to one original location, termed the “reference test bench”, where they were re-checked, batteries replaced, etc. Data was collected before the sources were shipped to the participants and the participants completed their measurement and returned their sources. There was one EF reference test bench in North America and one in Europe. The measurements at each of the reference test bench locations were used to establish a baseline.
Purpose
There are several components to the objectives of this round robin. As stated earlier, the primary reason was to evaluate the differences in the EF measurement equipment. A second objective was to observe measurement anomalies and outliers, to try to determine root cause. A third objective was to gain confidence in the EF measurement, so when test instruments are used in the field, one can feel confident in the network attenuation measurements. A fourth objective was to provide uncertainty analysis on the average of all participants' measurements, and assign a setup uncertainty to the measurement.
Explanation of Data
To reduce ambiguity and exclude the test sample variability from the round robin, the test results were normalized. In other words, a participants' test is made relative to the baseline test performed prior to shipping the sample to the test participant. The baseline test was used to set a new EF target with the EF template magnitudes as the boundaries. The 100% and -100% boundaries represent the spread between the lower and upper EF limits, not the actual values.
EFLΔ and EFUΔ represent the magnitudes relative to the EF target (now substituted with the baseline test) of the EF template. Baseline #5 is the test performed prior to sending the sample to the participant. Test #5 is the actual participant test. And post-test #5 is the test performed on the sample after it was returned from participant #5. In this example, participant #5 remained within the EF template. See figure 1 for more details.
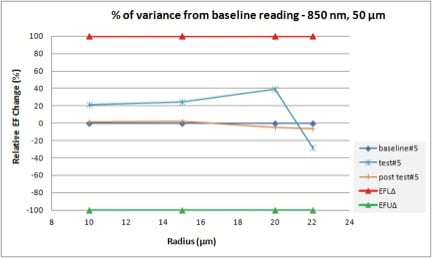
Figure 1 – Test result comparing pre and post baseline test
Long-term Drift
Early in the round robin, a drift phenomenon with the samples was observed. Since the test method used normalized measurements, the drift was not included in the data because it would have skewed the results. Independent testing revealed contraction in the 3 mm jacket used in the test cord.
This contraction was duplicated in a temperature chamber at elevated temperatures over many weeks. The contraction caused more mode filtering than what the test samples were first set to. Figure 2 shows the change in EF response over a 9–month period. The original test sample was set to the EF target at the center of the two dashed lines. For those unfamiliar with the EF template, figure 2 shows only the template at 20 μm and 22 μm. This is the area that mostly affects the loss measurements made with test equipment.
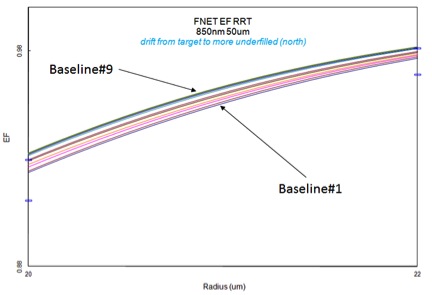
Figure 2 – Drift of samples over a 9 month period
850 nm 50 μm Test Results
For the sake of brevity, not all the data is shown in this paper. Figure 3 shows the compilation of all data for 850 nm on 50 μm cabling, as this is the area of most interest. All 14 tests were combined into one graph to show the average value and, based on the distribution of results, a one standard deviation band. One standard deviation represents a 75% confidence factor that all EF measurements are within the template.
During the round robin tests, all participants remained within the EF template. However, the distribution between participants varied so that the standard deviation increased.
In Figure 4, the average and two standard deviations are shown. Two standard deviations represents a 95% confidence that the EF results will remain within the standard deviation limits. Notice at the 20 μm control point, the two standard deviation dashed line is slightly out of the EF template. This amount represents about a 1.8% uncertainty during cabling attenuation measurements.
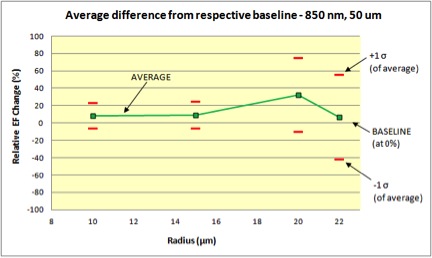
Figure 3 – Average and one standard deviation of tests
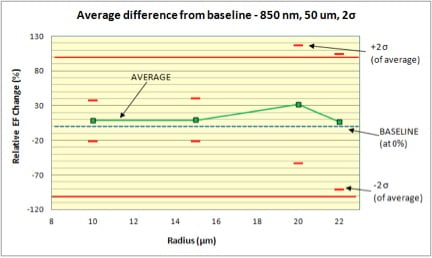
Figure 4 – Average and two standard deviations of tests
Summary
Two LED light sources were tested by 14 participants using various pieces of equipment capable of measuring EF. Each participant completed their test within a short time of the initial baseline test. All the tests were normalized by setting the baseline to zero. A reference test bench was used at two locations. A slow EF response drift was observed and attributed to temperature effects on the 3 mm jacket. All participants were within the EF template. The average EF results were well within the EF limits but the distribution of tests was not tightly grouped which contributed to the two sigma values. Using the average EF value and one standard deviation (75% confidence factor), all participants were within the EF template. For two standard deviations (95% confidence), there was an additional 1.8% uncertainty at one control point (20 μm for 850 nm/50 μm).
Conclusion
EF measurements can be made, for practical use, with reasonable uncertainty. And even with two standard deviation ranges and slight out-of-template results, EF is MUCH better than the previous standard like Modal Power Distribution (MPD). However, one must consider that the uncertainty is highly dependent on meeting EF at the target of the template. This makes a strong case to concentrate on 850 nm with 50 μm cabling. However, at this time, the EF standards do not differentiate between normative and informative requirements for wavelengths and fiber sizes.
The distribution of EF results could be related to differences in calibration, user skill, different types of equipment, non-compliance with IEC 61280-1-4, and other factors. Improving systematic uncertainty through better calibration and traceability will improve standard deviation (reduce distribution). At this time, EF equipment - while calibrated using precise artifacts – does not rely on traceability to a national standards laboratory.
For more information on Encircled Flux Compliant solutions – please visit www.flukenetworks.com/dtxefm
Authored by Seymour Goldstein, Fluke Networks December 2012.
Related Products
CertiFiber® Pro Optical Loss Test Set