WHITE PAPER
Troubleshooting Fiber
Download PDF
On This Page
- Potential Causes
- Visual Fault Locators
- Light Source and Power Meter (LSPM) and Optical Loss Test Set (OLTS)
- Optical Fault Finders
- Advanced Troubleshooting with Optical Time Domain Reflectometers (OTDR)
- Launch And Receive Cables and Compensation
- Understanding OTDR Results
- Advanced OTDR Settings - Pulsewidth
- Wavelength
- Thresholds and Averaging
- Advanced Trace Analysis
- Non-Reflective Events
- Real Time Trace
- Troubleshooting Fiber Jumpers
Potential Causes
Problems within a fiber link can occur due to a wide variety of reasons. A very common problem is that a connector is not fully engaged - often hard to notice in a crowded patch panel. Or it could be caused by the quality of the connector itself, such as poor end-face geometry that doesn’t pass the parameters defined by IEC PAS 61755-3 standards, including angle of the polish, fiber height, radius of curvature or apex offset.
A more common cause is poor field termination that results in air gaps and high insertion loss or scratches, defects and contamination on the end face of the connector. In fact, contamination remains the leading cause of fiber failures—dust, fingerprints and other oily substances cause excessive loss and sometimes permanent damage to connector end faces.
The issue could also be caused by a faulty fusion splice, misalignment or incorrect polarity. Poor cable management can put strain on a connector that causes misalignment, or the connector may not be properly seated and connected with its mate. Worn or damaged latching mechanisms on connectors or adapters are sometimes the culprit. Within the link itself, the fiber may have experienced microbends or macrobends, or it could have been damaged with a break somewhere along the length of the fiber.
The overall design of the cable plant can also be the cause of a fiber link experiencing insertion loss and performance issues. Even if all the connectors are high quality, free of contamination and properly terminated, if there are too many connections in a channel, the loss may exceed specifications for a given application. The same may occur from violation of distance limitations on multimode fiber, resulting in high modal dispersion.
Visual Fault Locators
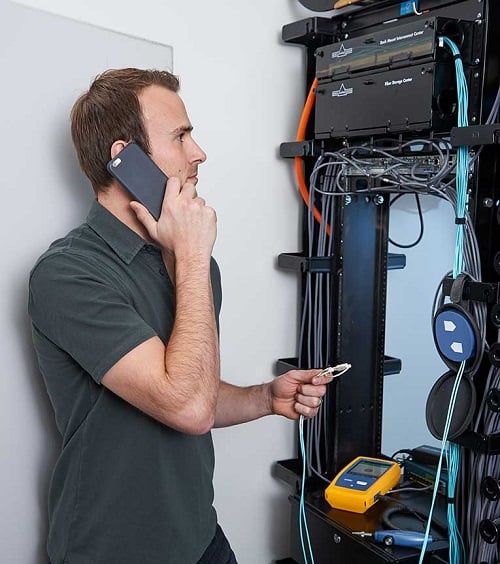
The simplest troubleshooting tool is the Visual Fault Locator, or VFL. This inexpensive tool that should be found in virtually every fiber technician’s tool bag uses a bright laser beam of light (typically red) that can be easily seen by the human eye, unlike the invisible infrared light used by active electronics within the system. A VFL is ideal for testing continuity and polarity from one end of the link to the other and finding breaks in cables, connectors and splices. It is also a great tracing tool for locating the other end of a single fiber terminated within a rack. Some field-terminated connectors also include a VFL window, which allows for connecting the VFL to the connector immediately following termination to verify that the termination was done correctly—if the light from the VFL escapes and appears in the connector’s VFL window, the two fiber end faces within the connector were not properly mated.
VFLs, such as Fluke Networks’ VisiFault™ VFL, that include both continuous and flashing modes can make for easier identification. VFLs that are compatible with various connector types via simple changeable adapters means only one VFL is needed for testing 2.5mm connectors such as SC, ST, FC, and FJ connectors and 1.25mm connectors such LC and MU connectors. A long battery life is also a key consideration, as well as overall rugged construction to maintain reliability.
A VFL can also be used for locating breaks, macrobend losses caused by a kink in the fiber and bad splice points. The red visible light of a VFL is bright enough to been seen through the fiber jacket at the break or macrobend location, especially in low light environments. This also makes the VFL useful for identifying bad splices within splice enclosures.
While considered a lower-level troubleshooting tool compared to others, a VFL is also a good accompaniment to OTDRs because it can locate faults that are too close together for an OTDR to properly isolate, as well as faults that are located too close to the OTDR within the “dead zone.” This can be especially helpful for identifying bad splices when using splice-on pigtails since they are near the end of the link.
Light Source and Power Meter (LSPM) and Optical Loss Test Set (OLTS)
Primarily used for Tier 1 certification and acceptance testing and the most accurate tool for measuring loss, a light source and power meter (LSPM) or Optical Loss Test Set (OLTS) can also be used for troubleshooting. By comparing the loss of the link to the requirements of the technology, you can determine whether or not the fiber link is the source of a problem. They can also be used to verify, output power from a device such as a switch, as well as continuity, and polarity.
Use an LSPM or OLTS to reveal if the loss is on a single fiber or on all the fibers in a cable. If there is loss on all fibers in the cable, this is a good indication that the cable is damaged or kinked. If there is loss on a single fiber, the problem is more likely associated with a bad splice or connector. It is important to note that neither an LSPM or OLTS will identify or locate specific loss events within the link. That’s where fault finders and OTDRs come in.
Optical Fault Finders
While VFLs work well for exposed lengths of fiber by illuminating bad connections and breaks, they are not very helpful for long cable runs, when the cable is not visible or accessible, or when the laser light can’t penetrate the jacket. Optical Time Domain Reflectometers (OTDR) provide graphical data and analysis along the entire length of a cable, but they can be expensive and require more time and skill to operate. When it comes to troubleshooting, optical fault finders fill the gap between a VFL and an OTDR.
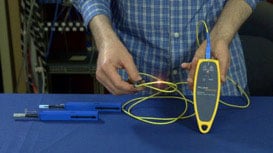
Optical fault finders such as Fluke Networks’ Fiber QuickMap quickly and efficiently measure length and identify high loss events and breaks on multimode up to 1,500 meters (4,921 feet). Very simple to use, this single-ended optical fault finder uses technology similar to an OTDR, sending a laser light pulse through the fiber and measuring the power and timing of light reflected from high loss connections and splices, and from the end of the fiber. They are ideal for measuring high-loss splices, connections and breaks in a fiber link, as well as the overall length of the link. The QuickMap also detects live optical signals before testing.
Being able to measure the length of the fiber quickly makes this a very useful tool. If you're testing a 3 kilometer fiber and the tool reports a length of 1.2 km, then you know it's broken. It's also extremely handy for finding MPO connections where both are unintentionally unpinned - this is a common problem which will result in a complete connection failure. This problem can be especially hard to find in patch panels where you can't easily or safely stare into the port to see if the pin is there or not.
These units are simple to operate. After cleaning the connections, a launch fiber is attached to the tester. Using a launch and tail fiber allow the testers to find incidents near or at the ends of the link. The user then presses TEST, and in a few seconds, the unit displays the number of incidents detected along the fiber link. Incidents include connectors, splices, and the end of the link. Incidents are defined as events that exceed a programmable limit for loss or reflectance. The user can scroll through each incident and view the distance and amount of loss of each. See figure 3 for an example.
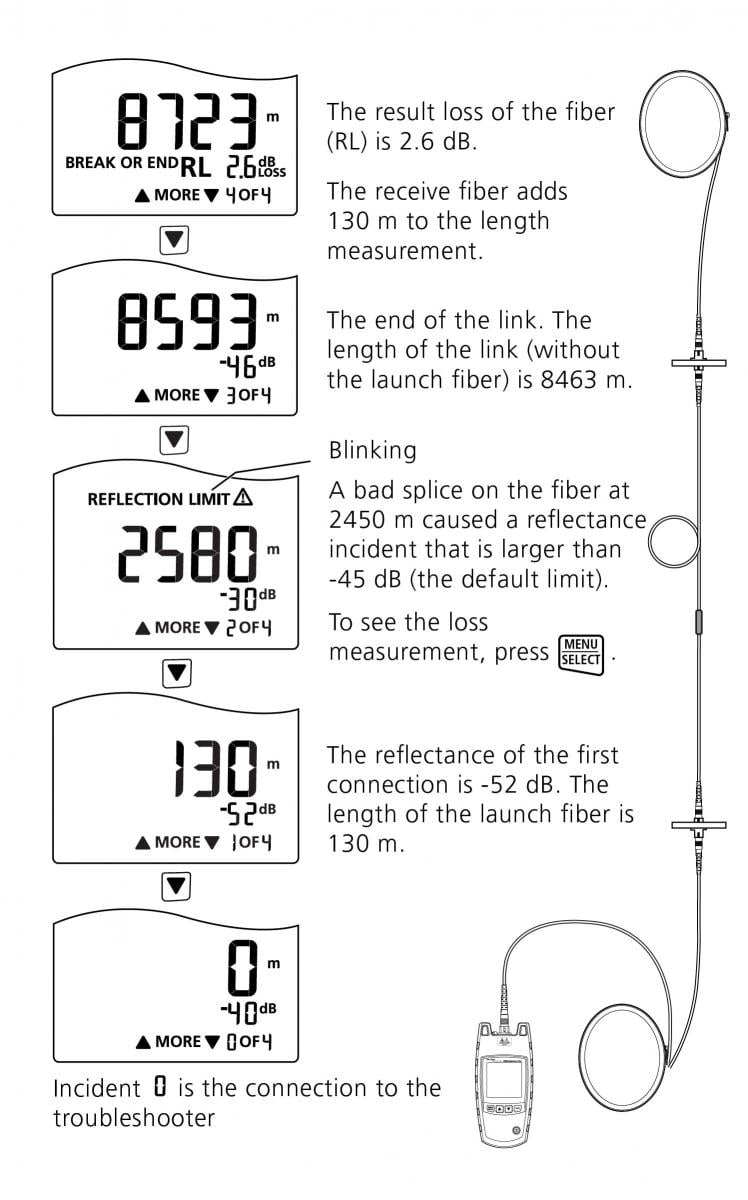
Figure 3. Optical Fault Finders identify the distance to reflective incidents along the length of the fiber link.
Advanced Troubleshooting with Optical Time Domain Reflectometers (OTDR)
While you may be able to pinpoint a problem with a VFL or optical fault finder, sometimes you simply need to know more. An Optical Time Domain Reflectometer (OTDR) calculates signal loss based on the amount of reflected light, or backscatter, that it detects. Using this technology, an OTDR can be used for locating fiber breaks, bends, splices and connectors and for measuring the loss of these specific events. Access to this level of detail with an OTDR arms you with a complete picture of the fiber installation and the overall quality of the workmanship. OTDRs are more expensive than VFLs, an LSPM/OLTS and optical fault finders, and they require some expertise, but because they measure the location, loss and characteristics of individual events, they are considered the ultimate troubleshooting tool.
An OTDR is the optical equivalent of an electronic time domain reflectometer. It injects a series of optical pulses into the fiber under test and extracts, from the same end of the fiber, light that is scattered (Rayleigh backscatter) or reflected back from points along the fiber. The scattered or reflected light that is gathered back is used to characterize the optical fiber. This is equivalent to the way that an electronic time-domain meter measures reflections caused by changes in the impedance of the cable under test. The strength of the return pulse is measured and integrated as a function of time, and plotted as a function of fiber length.
The Scatter Line, or Trace is used to infer loss based on drops in the strength of the Raleigh Backscatter signal. If Rayleigh Backscatter did not occur, then an OTDR would never have been designed. Rayleigh Scatter occurs in all fiber optic cables. Not all of the light energy can be absorbed by the glass molecules in the core of the fiber optic cable, so this unabsorbed light scatters in all directions. Only a tiny fraction of the light injected into a fiber is reflected back to the OTDR. This is the Backscatter (sometimes called Scatter) Line.
When light traveling through a fiber optic cable encounters a different density material such as air, up to 8% of the light is reflected back to the source, while the rest continues out into the new material. This is called Fresnel Reflection and shows where the connections are. By comparing the trace line before and after the connector, the loss and reflectance from the connector can be inferred.
Launch And Receive Cables and Compensation
Light scattered back to the OTDR for measurement is a tiny fraction of what is in the test pulse. Therefore, the OTDR receiver circuit has to be very sensitive. The connector in the OTDR generates a large reflection that saturates the OTDR receiver. It takes some time for the sensor to recover from this large reflection – much like your eyes need time to recover after a bright flash. Time equals distance, so by adding a launch cable between the OTDR and the first connector, the sensor has enough time to recover and be ready to see the reflection from the first connector in the link. The length of the launch fiber needs to long enough to support the maximum pulse widths needed for testing the lengths of fiber. With an adequate launch fiber (typically 100m or more), there is a scatter line in front of the first event, and scatter line afterwards, allowing the first connection to be measured.
When the light pulse hits the last connection in the link, a large reflection occurs because of the glass-to-air transition of the light. Since there is no more fiber at the end of the connection, there is no more backscatter and the measurement drops to the noise floor of the OTDR sensor. Using a Receive cable (sometimes called a tail cable) extends the backscatter, so there is backscatter before and after the last event. This allows the technician to measure and include the loss of the last connection in their test.
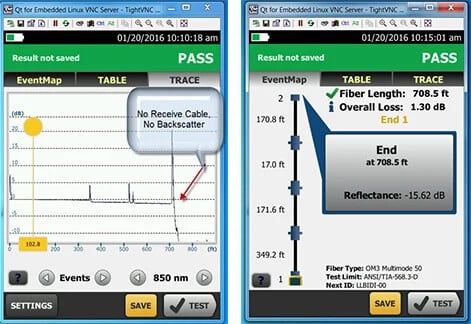
Figure 4. Without a receive or "tail" cable, the performance of the last connector cannot be observed.
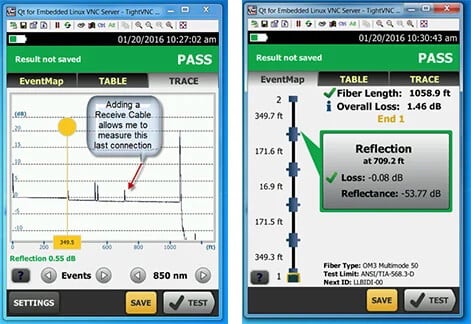
Figure 5. Adding a launch and receive fibers at the far end of the cable allow the OTDR to
measure the loss of the first and last connectors in the link.
Technicians and persons accepting the test results do not want the measurement of the Launch and Receive cables to be included in their reports, however. OTDR’s let you compensate (in effect, remove) the launch and receive cables, so all that is reported are the results from the link under test.
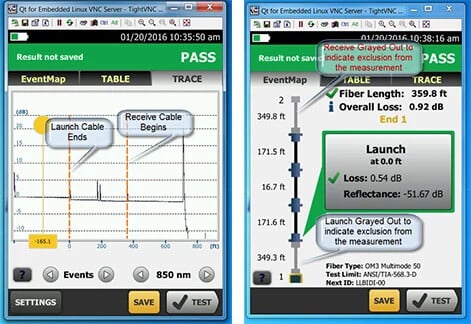
Figure 6. The trace includes the launch and receive fibers at the beginning and end of the
link under test. The EventMap shown at right uses launch compensation to remove their
effects from the test results.
Understanding OTDR Results
When you troubleshoot with an OTDR, you end up with a graphical signature of a fiber's loss along its length. While an OTDR trace can seem a bit overwhelming, it tells a story about the fiber link it tests with each dip or spike revealing the type of event.
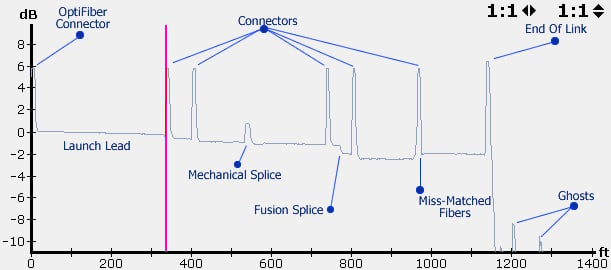
Figure 7. An OTDR trace result.
Experienced OTDR users will recognize reflective events for tester connectors, launch cords, connectors, mechanical splices, fusion splices, mis-matched fibers and the end of the link. And they will know that the little blips they see after the end of the link are ghosts, which are not real events to be concerned with.
But if you’re not a trace analysis expert, don’t worry. The OptiFiber® Pro also uses advanced logic to interpret the trace and provide an EventMap™ that characterizes the actual events. And faulty events are highlighted with red icons so you can locate your problem even faster.
Accessible via a help icon in the bottom left of the EventMap, OptiFiber Pro even suggests corrective actions for resolving any problems.
When troubleshooting a link with multiple questionable events, a good rule of thumb is to address the events nearest to the OTDR first. Once these are cleared up, the OTDR will have better visibility into the events further downstream.
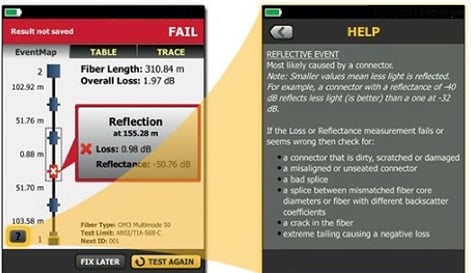
Figure 8. EventMap view with on-screen help
Modern OTDR’s automate many of the functions of the OTDR to make it easy for almost anyone to perform analysis like an expert. However, there are some instances where more expertise can be used to further analyze the fiber and find out more. The next two sections will discuss advanced OTDR settings and trace analysis.
Advanced OTDR Settings - Pulsewidth
Adjusting the pulsewidth allows the operator to trade the ability to measure on longer fibers against the ability to identify discrete events on the fiber. To ensure backscatter is returned to the OTDR from long distances, the tester has to put more energy into the cable by turning the light on for a longer period of time - increasing the pulse width. However, the longer the pulse width the larger the deadzone – the minimum distance between events that the OTDR can discern. Since light in a fiber travels at about 0.2 meters per nanosecond, a narrow 3 ns pulse would not be able to “see” two events that are less than 0.6 meters apart. A wide 1000ns pulse would be able to see two separate events only if they were more than 200 meters apart.
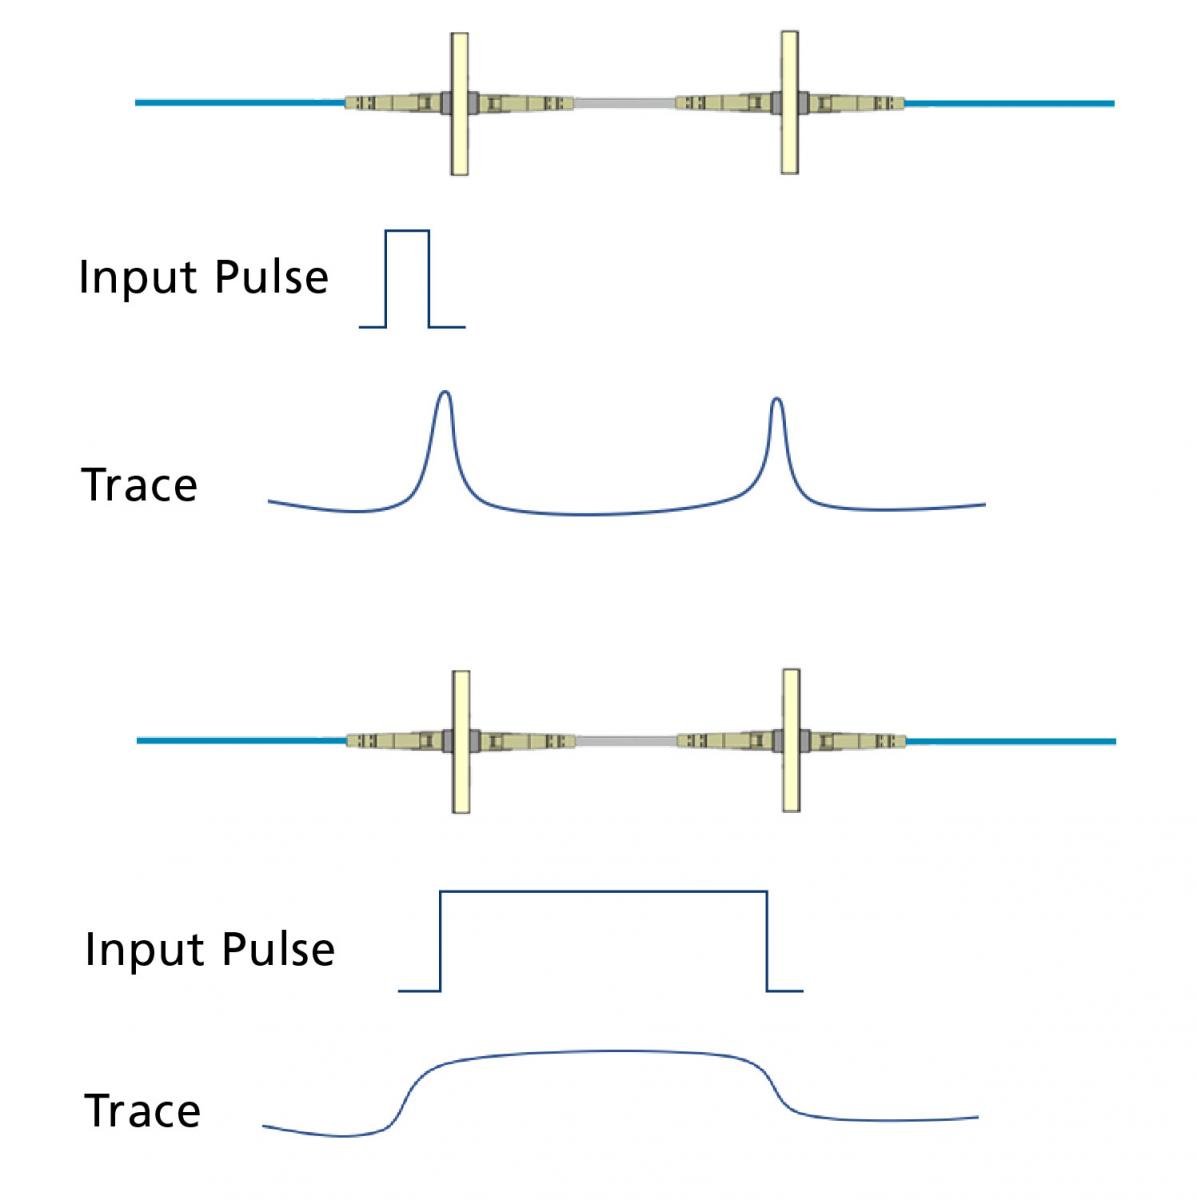
Figure 9. A narrower input pulse is able to discern events that are closer together.
Wavelength
Testing at multiple wavelengths should always be performed as it is the best way to ensure that you'll find bends or cracks in the fiber. Even if the application will only use the lower wavelength for transmission, when troubleshooting with your OTDR, it's best to test at both 850 and 1300nm for mutimode and 1300 and 1550 for singlemode. Normally, the higher wavelength would show a lower loss, but if the fiber is stressed, the higher wavelength will show significantly higer loss, and the problem will be easier to detect. Note that the wavelengths are "bound", meaning that the wavelengths noted above are sufficient for testing even if other wavelengths will be used in operation. If the problem is located at a splice-on pigtail, you may need a VFL to determine if the problem is a cracked or kinked fiber rather than the pigtail connector as the event on the trace will typically show up at about the distance to the connector. OptiFiber Pro features a handy built-in VFL for just this sort of situation.
Thresholds and Averaging
There may also be troubleshooting instances where the OTDR settings need to be manually adjusted. For example, when properly executed, a splice can exhibit a loss of less than< 0.1dB. If you need to locate a splice, and it has a very low loss, it may not show up on the OTDR if the loss threshold is set higher than the loss of the splice. Fluke Network's OptiFiber Pro Auto setting for Loss Threshold is 0.15dB, which means it will only find events at or above this level. The Loss Threshold can be manually set lower to locate extremely low-loss splices.
Note that smaller threshold values mean that the tester takes more measurements or uses wider pulse widths, which may increase test times or dead zones on the trace. A Loss Threshold of less than 0.15dB may also cause an OTDR to find false events due to inherent imperfections in the fiber. Changing the Averaging Time can also help locate fusion splices. Averaging Time sets the number of measurements averaged together to create the final trace - longer times reduce noise to reveal more details like non-reflective splice events. When troubleshooting long links, the dynamic range on the OTDR may need to be increased to measure to the end of the fiber, which also means wider pulse widths, resulting in increased test times and dead zones.
Advanced Trace Analysis
Traces show a slight downward trendline as they move away from the launch, which indicates the decreasing backscatter resulting from loss over the length of the cable. Connectors show up on the trace with a characteristic “spike” resulting from the reflection, followed by a drop from the trendline which indicates the loss (attenuation) attributed to the connector.
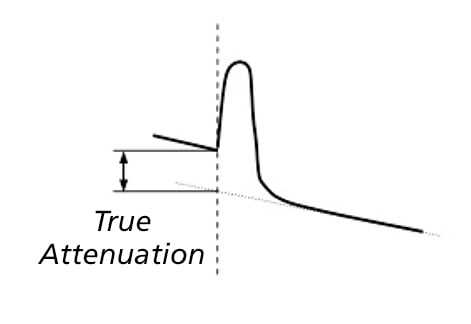
Figure 10. The drop in the trendline indicates the loss of the connector.
Non-Reflective Events
Non-reflective events are indicated by a drop in the strength of the backscatter signal without the “spike” shown from connectors. “Hidden” events are one example, caused by two connectors close enough to each other to be within the event dead zone of the OTDR.
Another example are “ghosts” - caused by a return from a highly reflective connection that results in a reflected signal that bounces back and forth between connections. Most ghost events will display as reflective events beyond the end of the fiber. However, some may show up in the trace. These ghost events can be identified because they are reflective events with no loss. The OptiFiber Pro detects ghosts, and then identifies the source, making it easy to fix the root cause.
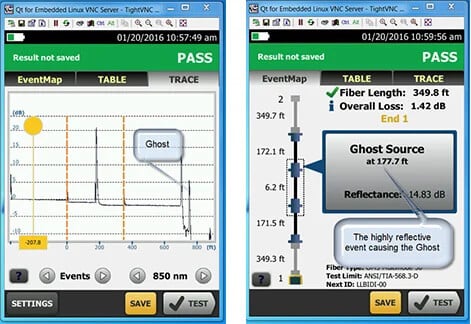
Figure 11. “Ghosts" are non-existent events resulting from strong reflected signals from actual events.
Real Time Trace
Real Time Trace is a continuously updated display of the fiber’s backscatter trace line. This feature can be used to test fiber on the spool to ensure there was no damage from shipping. This is done before pulling, or burying the fiber. Another use is the “Wiggle Test” – when loose connections, or damaged connectors are suspected, a technician uses real time trace while wiggling the connector, or pushing in on the connector to see if the connection recovers, or is permanently broken.
Troubleshooting Fiber Jumpers
Fiber jumpers are an integral part of any fiber network—whether used to make connections between fiber patching areas and switches in the data center or out in the LAN to connect end devices in a fiber-to-the-desk application.
Unfortunately, fiber jumpers are also typically the weakest link in the network. They are handled and manipulated more than any other component, which makes them more subject to damage. They are also often considered a commodity item and some end users will seek to save money by purchasing them from lesser-known generic sources that may skimp on quality and compliance.
After permanent link testing, which doesn’t include the fiber jumpers and is considered best practice for new installations, subsequent channel testing might identify problems. Troubleshooting of individual jumpers can be done using an optical loss test set (OLTS) like Fluke Networks’ CertiFiber Pro. This is achieved using the one-jumper reference method to set the reference and an adapter to connect the jumper to the test reference cord. With the other end of the jumper connected to the remote unit, only the loss of the connection between the reference cable and jumper is tested. Simply reversing the jumper tests the connector on the other end of the jumper.